Forex MT4/MT5 Indicators Forex Indicators & Strategies Download
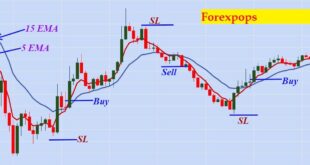
The MACD histogram plots the difference between the MACD line and the signal line on a vertical axis. When the MACD line is above the signal line, it indicates a bullish trend, while when the MACD line is below the signal line, it indicates a bearish trend.
The height of the histogram bars indicates the strength of the trend. If the bars are tall, it means that there is strong momentum in either direction (bullish or bearish). Conversely, if the bars are small, it suggests that there isn’t much momentum in either direction.
How to Use the MACD Histogram for Trading
It is based on the moving average convergence divergence (MACD) indicator, which is a trend-following momentum indicator that measures the difference between two exponential moving averages (EMAs).

he MACD histogram is composed of two lines: the MACD line and the signal line. The MACD line is the difference between the 12-period EMA and the 26-period EMA. The signal line is a 9-period EMA of the MACD line. These two lines are plotted on a separate axis below the price chart. The MACD histogram can be used to identify the direction of a trend, as well as its strength.
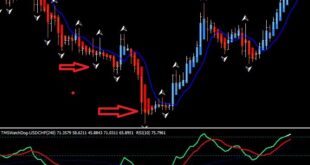
MACD Histogram Buy Sell Signal
The MACD Histogram is a powerful indicator that can help you to increase your profits in the market. Here are some tips on how you can use this indicator to your advantage:

1. Use the MACD Histogram to identify market trend reversals
The MACD Histogram can be used to identify when the market is about to reverse direction. When the histogram starts to rise or fall sharply, it is an indication that the market is about to turn. By acting quickly, you can make profits by trading in the opposite direction of the market.
2. Enter and exit trades using the MACD Histogram crossover signal screener
The MACD Histogram crossover signal is a strong indication of a change in market trend. When the histogram crosses above or below the zero line, it is a good time to enter or exit a trade, respectively.

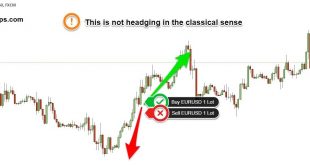
3. Take profits when the MACD Histogram reaches extremes
When the MACD Histogram reaches extreme levels (either very high or very low), it is an indication that the current market trend is coming to an end. By taking profits at these levels, you can maximize your gains before the market turns around.
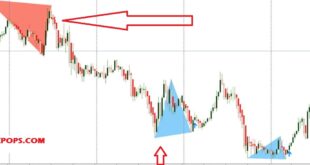
Free MACD Histogram Indicator MT4
MACD histogram trading for traders as it helps them identify 10 Tips For Trading Gold (XAU/USD) dynamic momentum and potential reversals in the markets. By using this strategy, traders can gain an edge by monitoring the price action combined with the corresponding direction of movement within each time frame.
This allows them to make informed decisions about entry points, exits, and position sizing within their overall trading plan. With practice and dedication, any trader can learn how to utilize this strategy effectively and reap its rewards.