Forex MT4/MT5 Indicators Forex Indicators & Strategies Download
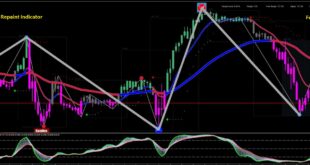
The “W Pattern” indicator that has gained attention for its ability to specific chart patterns that can hold valuable insights for traders. This comprehensive guide will take you through the nuances of the W Pattern indicator, its significance, interpretation, and practical application. The W Pattern, often referred to as the “Double Bottom” pattern, is a reversal pattern commonly observed on price charts. It derives its name from its visual resemblance to the letter “W.”
Trading M and W patterns PDF
This pattern is characterized by two distinct troughs (low points) that form at nearly the same price level, separated by a peak (high point) in between. The W Pattern indicates a potential shift from a downtrend to an uptrend, signifying a reversal of bearish sentiment.
The W Pattern holds significant implications for traders who are keen on spotting trend reversals early on. The pattern signifies that the market has found support at a particular level, causing the price to rebound after the formation of the second trough.
This can indicate that the bears are losing Candlestick Pattern their grip, and the bulls are gaining momentum. The W Pattern is often accompanied by increased trading volume during the formation of the second trough.
How to Use W Pattern Indicator for MT4
This surge in volume further reinforces the potential reversal, as it reflects growing interest and participation in the stock at that price level. To confirm the pattern, traders typically look for the price to break above the peak between the troughs, known as the “neckline.” This breakout serves as a trigger point, suggesting that the pattern is valid and a potential uptrend is in the making.


Traders can leverage the insights offered by the W Pattern in their trading strategies:
An entry point is typically considered once the price breaks above the neckline. This is seen as a confirmation of the pattern and an indication that the uptrend may be gaining momentum. To manage risk, traders often place their stop-loss orders just below the second trough.

M and W Pattern Strategy MT5
This helps protect against potential false breakouts and market volatility. The distance from the troughs to the neckline is often used to estimate the potential price movement after the breakout. This can guide traders in setting their target price for the trade.
The W Pattern indicator, or the Double Bottom pattern, trend reversals and seize opportunities for profitable trades. By understanding the pattern’s formation, significance, and confirmation signals, traders can enhance their ability to navigate the dynamic world of financial markets.
As with any technical tool, it’s essential to integrate the W Pattern into a comprehensive trading strategy, combining it with other indicators and risk management practices for consistent success.