Forex MT4/MT5 Indicators Forex Indicators & Strategies Download
The choice of indicator largely depends on the trading strategy you employ. For trend-following strategies, moving averages and trendlines can offer valuable insights into the direction of price movements. Oscillators like the Relative Strength Index (RSI) and Stochastic oscillator are favored for identifying potential overbought or oversold conditions, aiding in pinpointing possible reversal points.
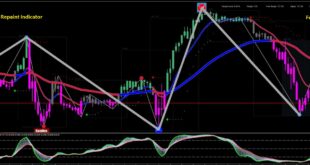
Best indicators for day trading
Volatility-based strategies often benefit from Bollinger Bands or Average True Range (ATR), which help gauge market volatility and set appropriate stop-loss levels. On the other hand, momentum indicators like the Moving Average Convergence Divergence (MACD) can capture the speed of price changes, aiding traders in identifying potential trend shifts.

Types of Indicators and Their Rules
These indicators help identify the prevailing market trend. Examples include Moving Averages and Parabolic SAR. They are essential for understanding the broader market direction. many successful traders do not rely on a single indicator but instead leverage a combination of indicators to corroborate their analyses. This fusion of indicators can provide more well-rounded signals by confirming each other’s observations and reducing false signals.
Oscillators:
Oscillators gauge overbought or oversold conditions, aiding in pinpointing potential reversals. Relative Strength Index (RSI) and Stochastic Oscillator fall into this category. Those who focus on short-term price movements may find oscillators like RSI and Stochastic helpful for timing entries and exits.
Volume-based Indicators:
These indicators focus on trading volume, giving insights into market participation and confirming price movements. On-Balance Volume (OBV) and Volume Weighted Average Price (VWAP) are notable examples.

Momentum Indicators:
Indicators like Moving Average Convergence Divergence (MACD) and Average Directional Index (ADX) help traders understand the strength and speed of price movements.
Moving Averages:
Simple Moving Averages (SMA) and Exponential Moving Averages (EMA) help identify trends and provide dynamic support and resistance levels. Investors seeking broader trends can consider using Moving Averages and MACD for decision-making. Traders aiming to capture price swings over a few days may benefit from trend-following indicators like Moving Averages.
Relative Strength Index (RSI):
RSI measures the speed and change of price movements, indicating overbought or oversold conditions. Backtesting involves applying indicators to historical data to assess their performance. Experiment with different indicators and settings on historical data to understand how they would have performed in the past.
MACD:
This indicator combines moving averages to identify changes in momentum, offering insights into potential trend reversals. The search for the ultimate indicator often leads to disappointment. Rather than seeking a one-size-fits-all solution, focus on combining indicators that complement each other and align with your strategy.
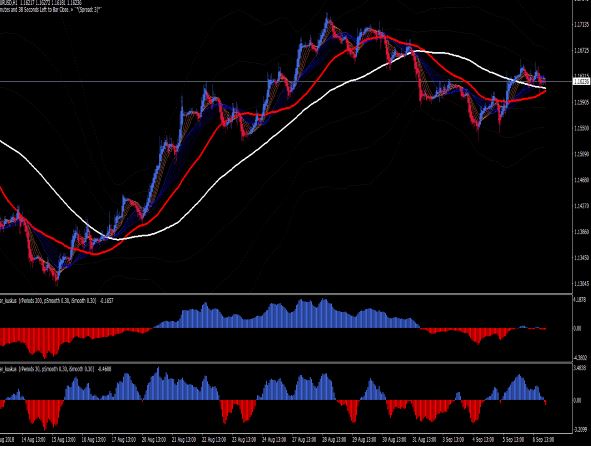
Best Indicator for MetaTrader 4
The best indicator for trading isn’t a solitary entity; it’s a strategic combination of indicators that align with your trading style, objectives, and risk tolerance. Your journey as a trader involves continuous learning, adapting to changing market dynamics, and refining your approach as you gain experience. Embrace the art and science of trading, and remember that success stems not only from the indicator you select, but from your ability to analyze, interpret, and respond to market movements with skillful precision.