Forex MT4/MT5 Indicators Forex Indicators & Strategies Download
The Guppy Moving Average Indicator was developed by Daryl Guppy, an Australian trader and author, in the early 1990s. Since then, it has gained popularity among traders due to its simplicity and effectiveness in analyzing price movements.
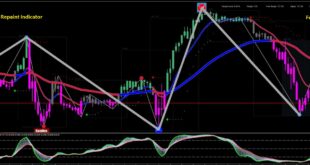
The indicator consists of multiple exponential moving averages (EMAs) with different timeframes, which are plotted on the price chart. The EMAs are color-coded for easy identification short-term EMAs are blue, medium-term EMAs are green, and long-term EMAs are red. This color-coding system helps traders quickly assess the strength of a trend.
How to Trade with the Guppy Multiple Moving Average
The main premise behind the Guppy Moving Average Indicator is that by combining multiple EMAs with varying timeframes, it provides a more accurate representation of market sentiment. Shorter-term EMAs tend to react faster to price changes, while longer-term EMAs give a broader view of the overall trend.

One of the key advantages of using this indicator is its ability to filter out noise and false signals in volatile markets. By using multiple EMAs instead of just one, it smooths out price fluctuations and gives a clearer picture Zero Lag Exponential of whether a trend is developing or not.
Guppy Multiple Moving Average Setting
The Guppy Moving Average (GMA) indicator combines multiple exponential moving averages (EMAs) to provide a more accurate representation of price movements.
So, how does the GMA indicator work? Let’s break it down into three main components: calculation, interpretation, and application.
Multiple Moving Average Calculation
The GMA indicator uses short-term and long-term EMAs to create a ribbon-like formation on the chart. The short-term EMAs are typically between 3 and 15 periods, while the long-term ones range from 30 to 60 periods. These EMAs Moving Average Method are then plotted together on the chart, creating multiple lines that move in unison.


Guppy Multiple Alert Moving Average Trading Strategy
The main idea behind this indicator is that when short-term EMAs cross above or below longer-term ones, it signifies a change in trend direction. When all EMAs are stacked together in an upward direction, it indicates an uptrend.
Conversely, when they are aligned downwards, it signals a downtrend. the distance between each EMA also provides valuable information about market momentum. A wider gap between EMAs suggests strong momentum in either direction while a narrower Buy Sell Indicator V3 gap indicates weakening momentum.

Traders can use the GMA indicator in various ways to make trading decisions. One common strategy is called “the ribbon squeeze,” where traders look for periods of consolidation when all EMAs converge into one tight ribbon formation Ichimoku Cloud Strategy before breaking out in one direction.
Another approach is using crossovers between shorter and longer term EMAs as entry or exit points.
EMAs Buy Sell Setting
Traders can go long when short-term EMA crosses above longer-term ones and vice versa for short positions. However, like any other technical indicators, these signals should be confirmed with other factors, such as price action and volume. It is also worth noting that the GMA indicator works best in trending markets. In ranging or choppy markets, the EMAs may crisscross frequently, resulting in false signals.